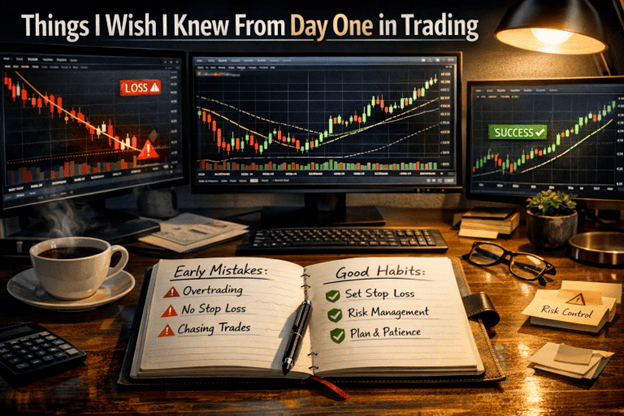
No.2 Starting in Trading: What I Wish I Knew From Day One

πŸ“Š Spread & Slippage: The 2 Hidden Trading Costs You Need to Control

🚨 Did you know that spread and slippage can cost you money WITHOUT you even realizing it?

First, let’s clarify something: spread and slippage are not commissions. They are trading costs that you may incur when executing a trade.

1️⃣ SPREAD β€” The Bid/Ask Difference

Definition:
The difference between the bid price and the ask price of an asset.
It represents an implicit cost of trading and is closely related to market liquidity.


🧱 Formula:
Spread = Ask Price βˆ’ Bid Price


πŸ“Œ Practical Example β€” Tesla:

Bid: $340.50 β†’ what buyers are currently willing to pay
Ask: $340.55 β†’ what sellers are currently willing to pay
Spread$0.05


πŸ”Ž Where can you see it?

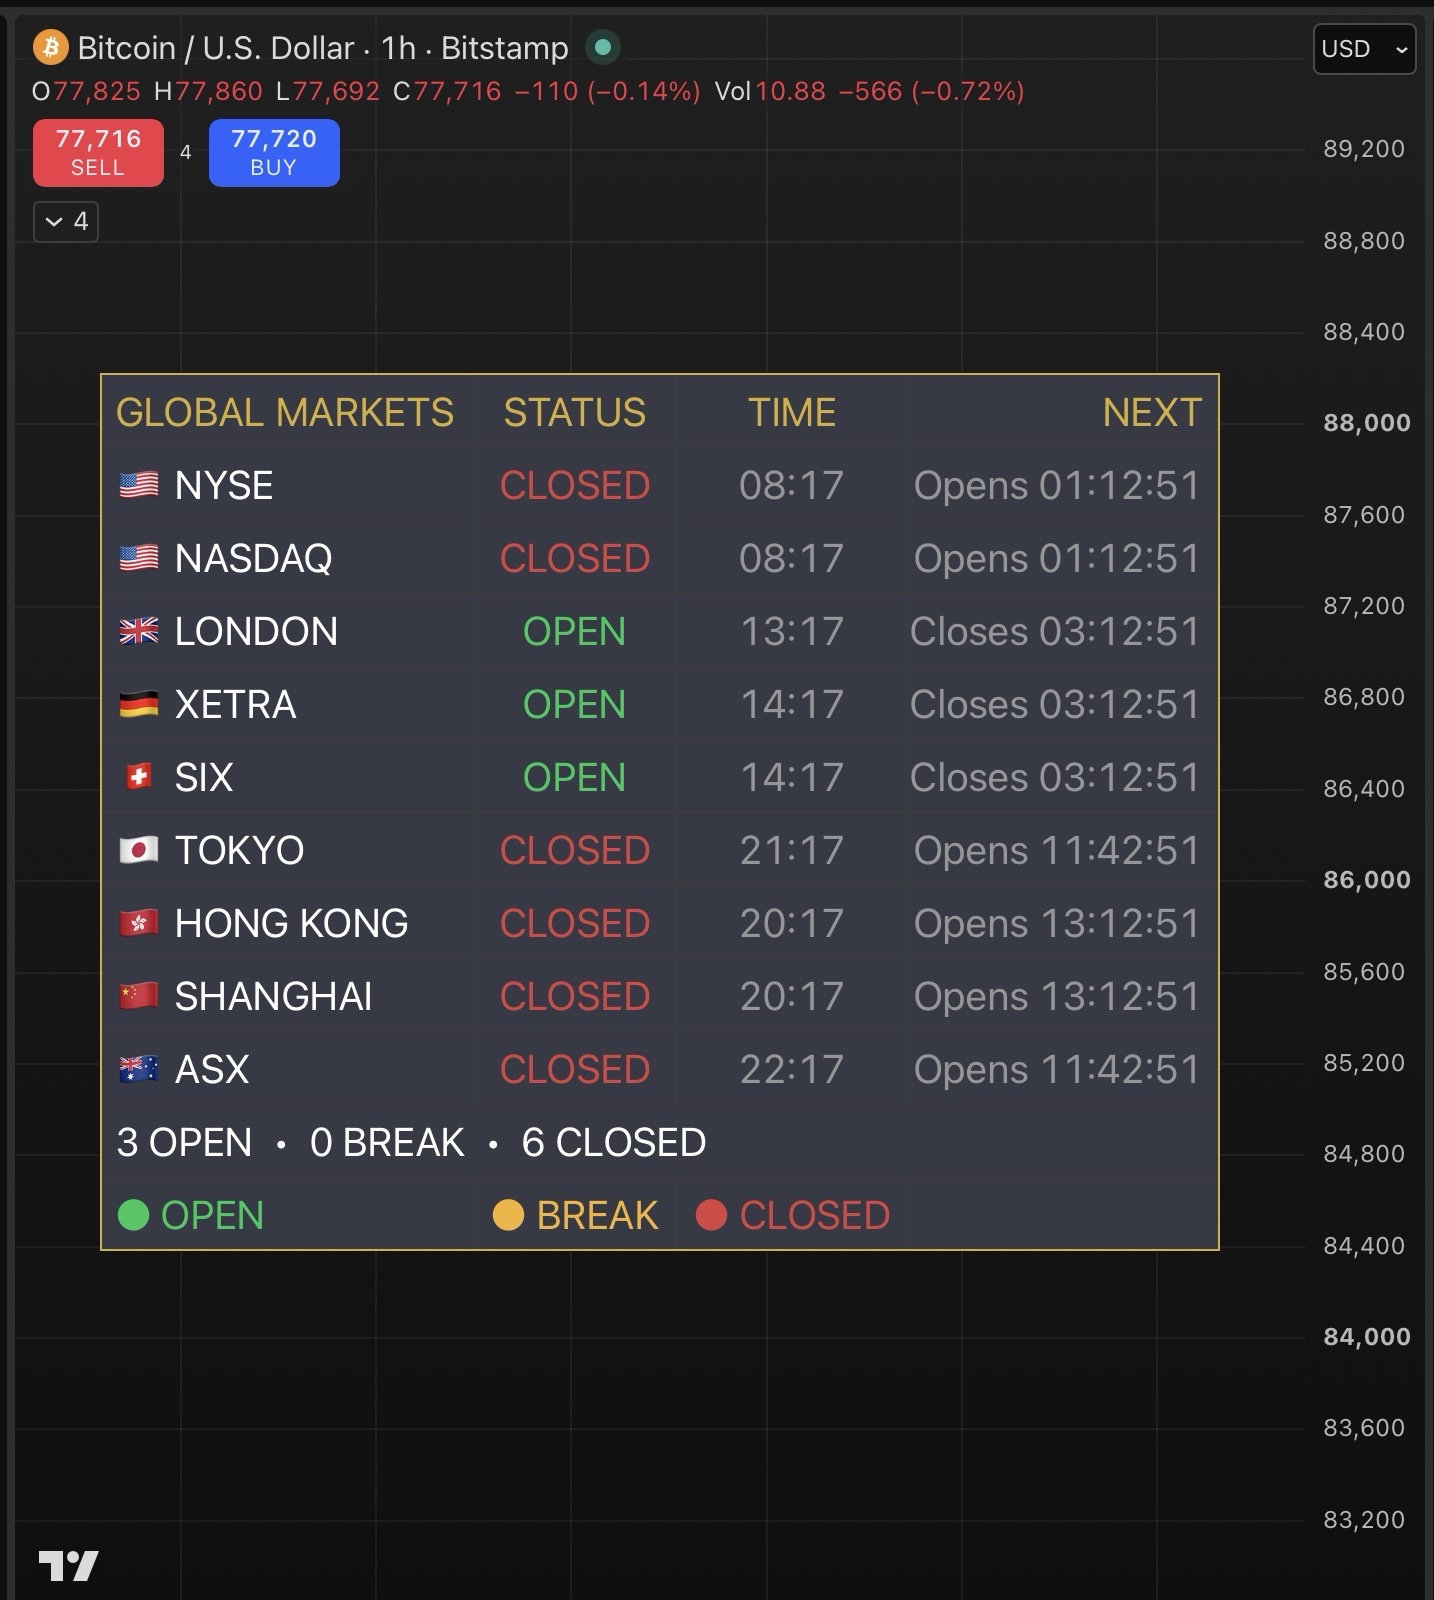
Check the top-left corner of the TradingView chart, where the bid/ask prices are displayed.


🧠 What does this mean for you?

If you want to buy immediately, you generally pay the ask ($340.55).

If you then wanted to sell immediately, you would generally sell at the bid ($340.50).

⚠️ That $0.05 difference is the spread.

In other words, you start with a $0.05 per-share difference to overcome before the price moves in your favor.


πŸ€” Why does it matter?

βœ… A lower spread is better for traders because it means a lower transaction cost.

πŸ’§ In highly liquid markets, the spread is usually tighter.

⚠️ In less liquid markets, spreads can become significantly wider.

πŸ’‘ This is why the spread is an important trading cost to understand. The tighter the spread, the less price movement you generally need to overcome that initial difference.


2️⃣ SLIPPAGE β€” When Your Execution Price Changes

Definition:
The difference between the price you expect to get and the actual price at which your order is executed. Slippage can happen because of volatility, low liquidity, or execution delays.


πŸ“Œ Types of Slippage
βœ… 1. Positive Slippage: Sometimes, an order executes at a better price than expected.
Example: You expect to buy at $10, but your order fills at $9.90.

❌ 2. Negative Slippage: Your order executes at a worse price than expected.
Example: You expect to buy at $10, but your order fills at $10.10.


πŸ€” What Causes Slippage?

πŸŒͺ️ Volatile markets: Economic news, geopolitical events, market shocks, etc.
πŸ’§ Low liquidity: Not enough buyers or sellers at your desired price.
⚑ Market orders: They execute at the best available price, which can change within milliseconds.


🎯 Bottom Line:

βœ… Low spread + high liquidity = generally better trading conditions.
⚠️ High volatility + low liquidity = greater risk of slippage.

🧠 Understanding these costs is part of becoming a better trader. Small costs can add upsignificantly over hundreds or thousands of trades.


πŸ’¬ Have you ever been surprised by spread or slippageTell us about it in the comments!

πŸ‘‡ Is there a trading topic you’d like us to explain? Drop it below!

πŸš€ Boost | πŸ” Share | πŸ’¬ Comment | βœ… Follow us for more educational content

LearnKeep what works for you. Add your own edge.

WFF

πŸ”—Publication link: https://www.tradingview.com/chart/GOLD/0igQE5FG-No-2-Starting-in-Trading-What-I-Wish-I-Knew-From-Day-One/

Every Trader’s Indicator PRO

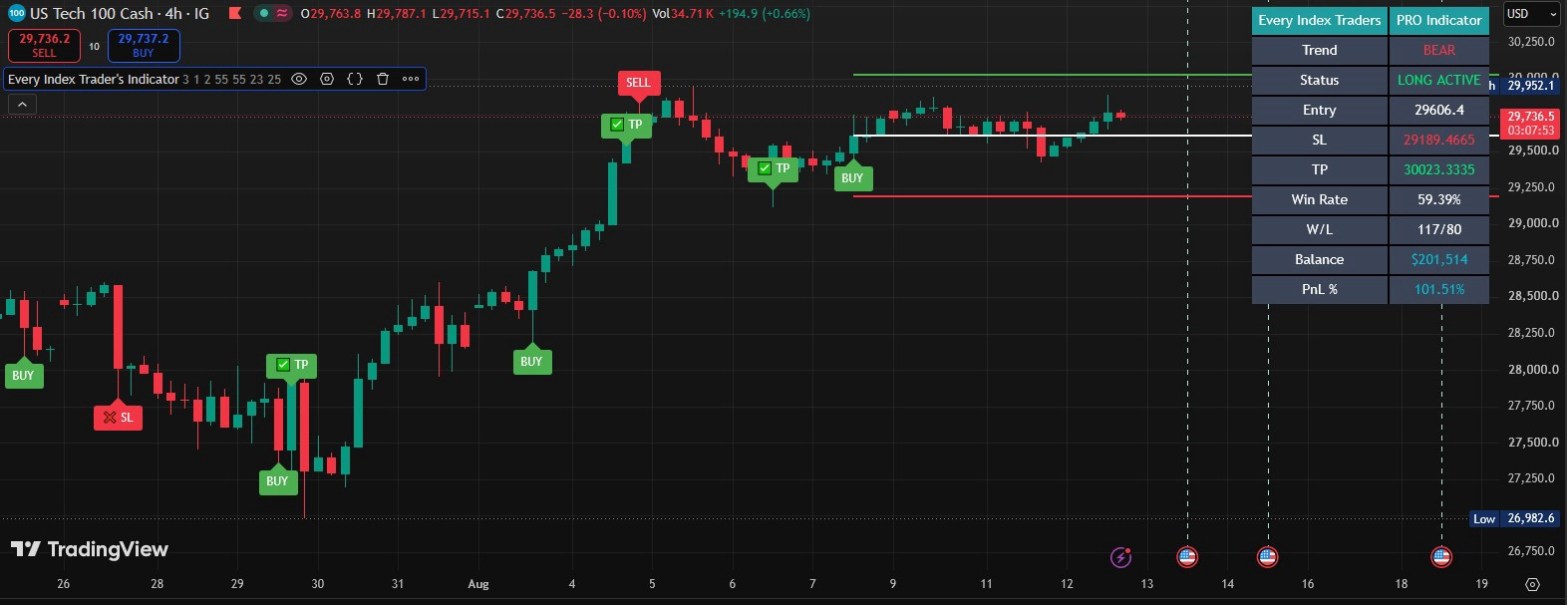
Today we will talk about this new indicator we have been working for months on and will be available to the public. After several tests it’s ready to launch. Every Trader’s Indicator PRO is a multi-factor trading system designed to generate high probability buy and sell signals by combining trend direction, momentum, volume confirmation, and liquidity sweep detection. It also includes a built-in trade engine with automatic stop loss and take profit levels based on ATR and a configurable risk-to-reward ratio. This indicator filters market conditions using a customizable Signal Quality setting, allowing traders to choose between higher signal frequency or stricter trade selection. A built-in scoring system evaluates each setup based on trend alignment, RSI momentum, volume strength, and liquidity sweeps to produce precise entries. It is designed to help traders to take high-quality trades but at the same time keep tight rules.

β€”β€”β€”β€”β€”β€”β€”β€”β€”β€”β€”β€”β€”β€”β€”β€”β€”β€”β€”β€”β€”β€”β€”β€”β€”β€”β€”β€”β€”β€”β€”β€”β€”β€”

Key Features

  • Trend Detection: Uses fast and slow EMA alignment to define bullish or bearish market structure
  • Momentum Filter: RSI confirmation helps validate strength behind entries
  • Liquidity Sweeps: Detects stop-hunt behavior using previous highs and lows for reversal opportunities
  • Volume Confirmation: Ensures trades only trigger during above-average market activity
  • Signal Scoring System: Multi-condition scoring model improves trade accuracy and filters weak setups
  • Dynamic Trade Engine: Automatically plots entry, stop loss and take profit levels using ATR-based risk management
  • Risk-to-Reward Control: Adjustable RR ratio for flexible trading strategies
  • Performance Tracking: Built-in win/loss tracking and win rate calculation
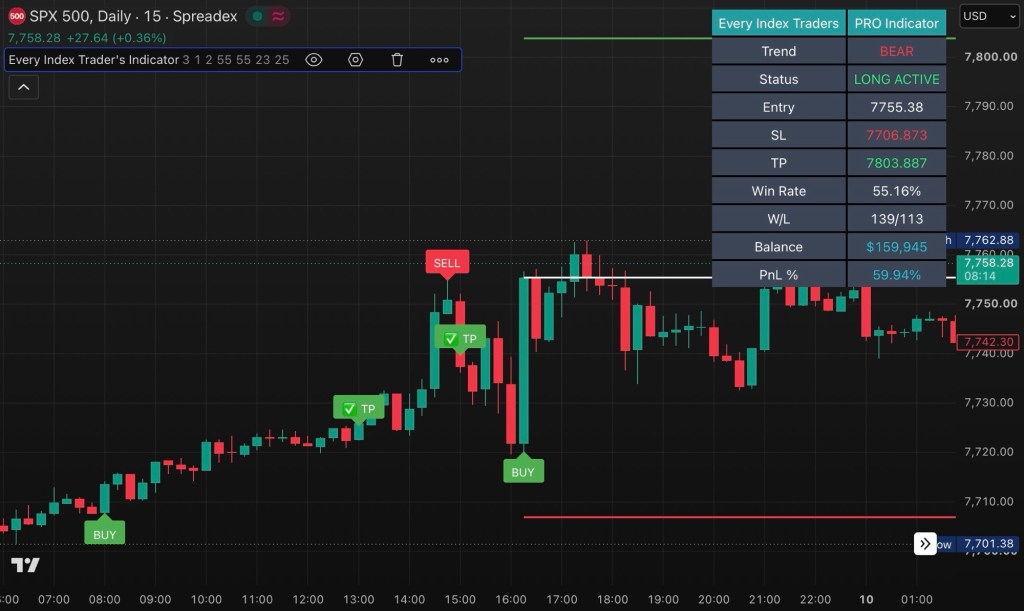
  • Visual Trade Labels: Clear BUY/SELL signals with TP/SL markers directly on chart. When in trade three visual lines will be drawn automatically. The green line represents the TP, red line represents SL, and white line is the entry point.

β€”β€”β€”β€”β€”β€”β€”β€”β€”β€”β€”β€”β€”β€”β€”β€”β€”β€”β€”β€”β€”β€”β€”β€”β€”β€”β€”β€”β€”β€”β€”β€”β€”β€”

How It Works

When conditions align across trend, momentum, volume, and liquidity structure, the indicator assigns a score to the setup. Once the minimum threshold is met, a trade signal is triggered and the system automatically plots entry, stop loss and take profit levels based on market volatility (ATR). The trade remains active until either TP or SL is hit, after which the result is recorded.

β€”β€”β€”β€”β€”β€”β€”β€”β€”β€”β€”β€”β€”β€”β€”β€”β€”β€”β€”β€”β€”β€”β€”β€”β€”β€”β€”β€”β€”β€”β€”β€”β€”β€”

Usage

This indicator is designed to help new and experienced traders who want a structured, rules-based approach to entries and exits. It works on any timeframe and market.

Trade the Plan, NOT the Emotion:

This indicator in simple words is a structured confirmation system that helps you identify potential setups define your entry, stop-loss and take-profit, and maintain consistent risk management.

Disclaimer: No indicator guarantees profits. This indicator should never substitute your analysis.

πŸ‘‡Feel free to comment belowπŸ‘‡

No.1 Starting In Trading: What I Wish I Knew From Day One

πŸ”ŽIntroduction:πŸ”

   I began trading with zero knowledge of how the markets actually worked with no one to help meβ€”I didn’t even know how to properly read charts. 

   As a self-taught trader, I spent countless hours learning the basics, studying price movements, and trying to build an understanding from the ground up.

   At the time, I assumed success was mainly about finding the right strategy and applying it consistently. That assumption proved incomplete. What I didn’t fully understand from day one wasn’t just how the market moved, but the importance of risk management, discipline, and the very important role of psychology in decision-making. 

   These are lessons I learned through experience, and ones I wish I had understood since day one. Today, we will be looking at 6 lessons I learned through trial and error.

🧱1. Understanding the Basics Matters More Than You Think🧱

  When I started, I underestimated how important it was to truly understand the fundamentalsβ€”especially how to read charts. I rushed past the basics, assuming I could pick things up along the way. In reality, that lack of foundation made everything more difficult. Without a clear understanding of price action, even the best strategies felt inconsistent. Looking back, taking the time to properly learn the fundamentals would have saved me from a lot of unnecessary mistakes early on. 

πŸ”—πŸ’Ž2. Risk Management Is More Important Than Being RightπŸ’ŽπŸ”—

Early on, I focused too much on trying to predict the market correctly. What I didn’t realize is that even experienced traders are wrong a significant portion of the time. The difference is that they manage risk effectively. One poorly managed trade can undo a series of good ones. Learning to control position size, define risk before entering a trade, and protect capital is far more important than trying to win every single trade.

πŸ’Έ3. Losses Are Part of the ProcessπŸ’Έ

One of the biggest mindset shifts was accepting that losses are not a failureβ€”they are part of trading. In the beginning, every loss felt like a mistake that needed to be avoided. Over time, it became clear that losses are inevitable. The goal is not to eliminate them, but to keep them small and controlled. Consistency comes from managing losses, not avoiding them entirely. You will always have losses but with risk management your losses will be much smaller.

😎4. Psychology Plays a Bigger Role Than Expected😬

I initially believed trading was mostly technical. In reality, emotions play a major role in decision-making. Fear can cause hesitation or early exits, while overconfidence can lead to unnecessary risk. Maintaining disciplineβ€”especially after a win or a lossβ€”is one of the most challenging aspects of trading. Developing consistency in behavior is just as important as developing a strategy. One of the hardest things for me to learn was when to take profit and when to cut my losses because we get emotional. Also a common mistake is if u close a trade in a loss don’t place a trade immediately analyze, think through it, and then place your trade.

πŸ’‘Tip: We all have good days and bad days sometimes a walk away from the screen before placing a trade helps u take away emotions and see the big picture!

πŸ’»5. Overtrading Can Do More Harm Than GoodπŸ“‰

At the beginning, I felt the need to always be in the market. This often led to taking low-quality setups simply for the sake of being active. Overtrading not only increases risk but also reduces focus and discipline. Some of the best decisions come from choosing not to trade. Patience is a skill that takes time to develop, but it has a direct impact on long-term results. 

πŸ’‘Tip: Spending too much hours sitting in front of a screen is not good for your health. From time to time stand, excercise, spend time with your family; this will not only help your health but your trading will improve. 

🎯6. Simplicity Is an Advantage🎯

There is a tendency to overcomplicate trading by using too many indicators, strategies, or sources of information. I went through that phase as well. Over time, it became clear that simplicity leads to better decision-making. A clear, well-understood approach is far more effective than constantly switching between methods or trying to follow conflicting signals.

You even can be profitable with zero indicators–Of course indicators can make trading easier but a simple strategy can even be more profitable than the most complex indicator. So keep it simple. That’s why our indicators are made as simple as we can so that anyone can understand them.πŸ˜‰ 

πŸ†ConclusionπŸ†

If I could go back to day one, I wouldn’t focus on finding a better strategyβ€”I would focus on building a stronger foundation. Understanding risk, developing discipline, and keeping things simple would have made a significant difference early on. With this in mind, it is why our indicators are made to teach you a strong foundation. Because trading is not about being right all the time; it’s about managing decisions effectively and staying consistent over time. The sooner these principles are understood, the smoother the learning process becomes. With patience and determination anyone can become a profitable trader.

Design a site like this with WordPress.com
Get started